Short instruction for paceval. ‘approximation’ demo
This paceval. demo application shows you how fast and precise approximations of numerous data points can be handled. Click here>> for the latest version.
1. Import measured data points into the approximation demo application
You can either type your values directly into the grid or, which might be more convenient, import your data from a comma-separated values file (.csv).
To import the data from a comma-separated values file (.csv) please make sure that the data is arranged in such a way that the two values are separated by a comma (,) in each row. The first number represents the value of the input and the second number the value of the output of each measured point as a floating point number. Now just click on ‘import .csv’.
The input data needs to be ordered in size and the floating point number should have a dot (.) to indicate decimal points. Please do not use expressions such as ‘NAN’ or ‘INF’.

2. Create approximations, generate function
If you have input your data points, please click on ‘generate function’ to get your approximations and set your variable name , e.g. ‘x ‘or ‘y’ first. This is in particular helpful if you do not have a good representation of your function in a closed form or you need fast calculations for your mathematical model.
As paceval. itself has no limitation for the length of the mathematical function you can create any kind of function or mathematical representation from your data points with the precision you need.
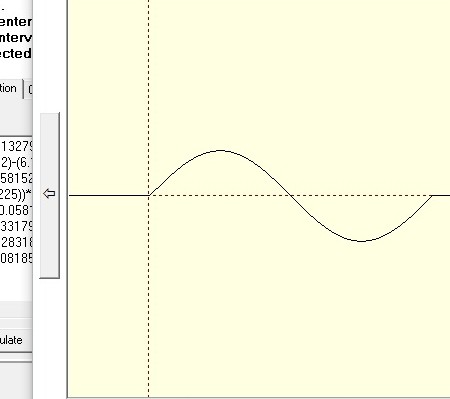
Please have a look on our example >> which shows you how precise and fast the paceval. approximation works.
We have used the following function with 255 data points: f(x)=sin(x) from 0-2*pi
3. Insert function into the calculation demo application
Just copy your function with by right-clicking on the function field, then choose ‘select all’ in the approximation demo. Now insert your function by right-clicking and selecting ‘paste’ in the function editor of the calculation demo application.
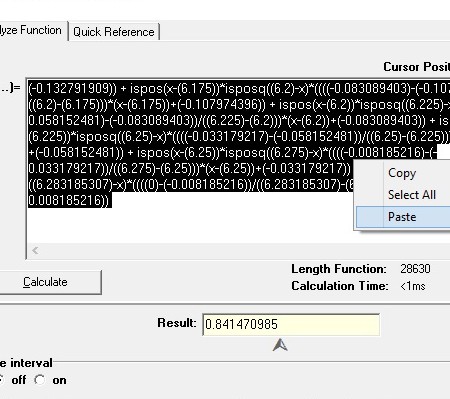
4. Perform calculations and show graph
Now you can set variable names and variable values. Press ‘calculate’ to get the result for the given values. In our example the function consists of 28.630 characters.
If you press ‘calculate’ for the first time the function is analyzed, checked for errors and a cache memory is created. When you now re-do the calculation and change variable values you will see that the calculation time is now significantly reduced, e.g. less than a millisecond due to the caching method. Of course, the exact speed is always depending on your processor speed.
5. Download source code version for your own requirements
If you download the source code version of this demo application you can easily extend it to your needs or use the sample code in your application. E.g. you could generate functions which uses for each data point another variable, i.e. for given measured data x1-xn, the variables are x1-xn. paceval. itself has no limitation in the number of variables or formula length.